Individual next-cycle management for chemotherapies
Help Index > Individual next-cycle management for chemotherapies
1. Background
Chemotherapies of many cancers are not only toxic to the tumour but also to other proliferating tissues such as the blood formation system.
Hence, reduction of blood cell lines is a frequent side-effect of cancer therapies. In case of severe reductions, this could be life-threatening.
Since this side-effect is heterogeneous between patients, we constructed systems-biological models to predict the toxicity of the next therapy cycle on an
individual level. The models also allow simulating adaptations of the next cycle treatment, i.e. reducing the dose of cytotoxic drugs, postponement of therapy
or provision of supportive treatment such as growth factor applications.
2. Problem
In figure 1, we show the therapy course of a patient treated with CHOP-21 chemotherapy. Besides the simulation of the actually given therapy (blue),
the model allows for simulations of therapy adaptations. To support treatment decisions, there is need of an easily applicable tool to explore the effects
of possible treatment adaptations so that the physician can decide about the next cycle treatment, e.g. whether it can be applied safely on time
or whether dose reductions are necessary.
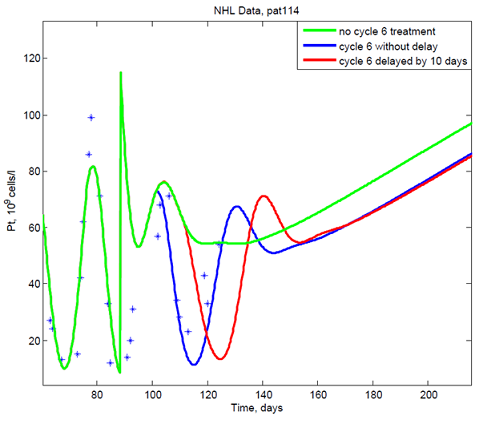
Figure 1: Individualized biomathematical model of platelet formation under chemotherapy: Blue asterisks represent patient data. The model is fitted to these data using other information as priors (blue curve). One can simulate the effect of treatment adaptations such as no further therapy (green curve) or postponement of next cycle by 10 days (red curve).
Figure 1: Individualized biomathematical model of platelet formation under chemotherapy: Blue asterisks represent patient data. The model is fitted to these data using other information as priors (blue curve). One can simulate the effect of treatment adaptations such as no further therapy (green curve) or postponement of next cycle by 10 days (red curve).
3. Solution
Our model was implemented as Shiny-App and deployed into the Health Atlas.
The tool allows for uploading own patient data (not available in the guided tour).
Then the model can be fitted to these data. We provide a slider system to explore the results of possible treatment modifications comprising therapy
postponement, dose modifications and duration of simulation. Model simulations are automatically updated in dependence on the slider setting.
Results of simulations are provided as predicted time series for the individual patient. Degrees of thrombopoenia are provided to facilitate
interpretation of the results.
4. Results
Our model is presented as easily manageable tool to facilitate individual treatment management. The implementation can be used by physicians as
a research-use-only tool. At this, we demonstrated that the Health Atlas can support systems-medical applications.
Weblink: https://apps.health-atlas.de/thrombopenia/
Weblink: https://apps.health-atlas.de/thrombopenia/